
In its fifth and final summer session, Map Club delved into the geographic projection capabilities of D3.js, a JavaScript library for manipulating documents based on data. D3 supports a comprehensive range of both common and unusual projections, further augmented by the most recent 4.0 release. Attendees sought to become familiar with the syntax for rendering JSON data in the browser, to add interactivity and data-driven attributes to different geographic regions, and to explore some of the less common projections offered by the library.
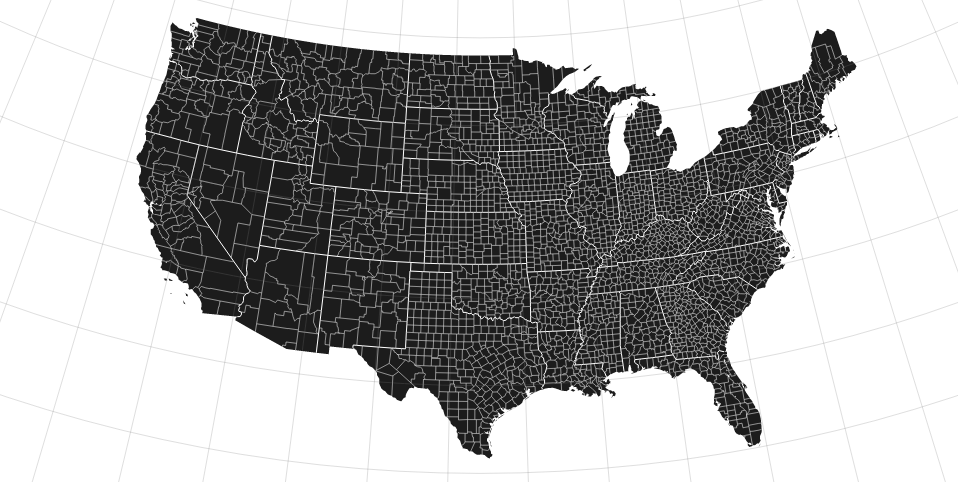
Tricia used the Albers Equal-Area Conic projection to render outlines of U.S. states and counties, while Emily aligned Gnomonic, Orthographic, and Stereographic projections in an interactive sphere:

Paul Ronga created an impressive interactive map visualizing Swiss census data (view the full version here):

For this session’s resources and materials, visit the Map Club Github repository. And that’s a wrap! Thanks for a great summer series, everyone!