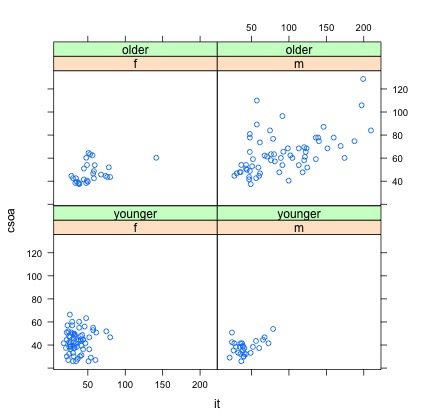
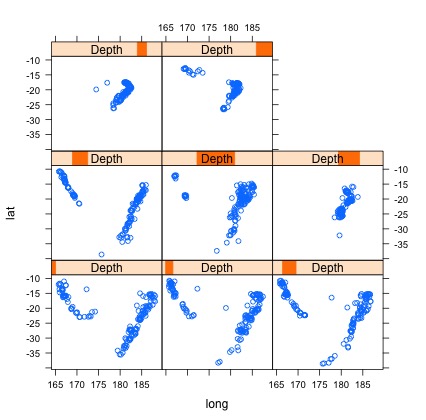
Yesterday we briefly talked about how to do plotting in R. We mainly discussed plot(), barplot(), hist() and Lattice package. Thank you to everyone who showed up and we will explore more data visualization techniques for next session.
Also, from next session on, the open lab will be much less structured and will involve more discussion about personal projects, so people with different level of knowledge are welcome to join!
See you next Wednesday 10/19/2016 at 10:00 AM!