
This week, Map Club embarked upon its second session by experimenting with Kartograph, a lightweight framework for building interactive map applications without an external mapping service. Kartograph is comprised of two libraries: the first is a Python library, Kartograph.py, which generates compact, Illustrator-friendly SVG maps from shapefiles and PostGIS; the second, Kartograph.js, is a JavaScript library for creating interactive SVG maps based on Kartography.py SVG maps.
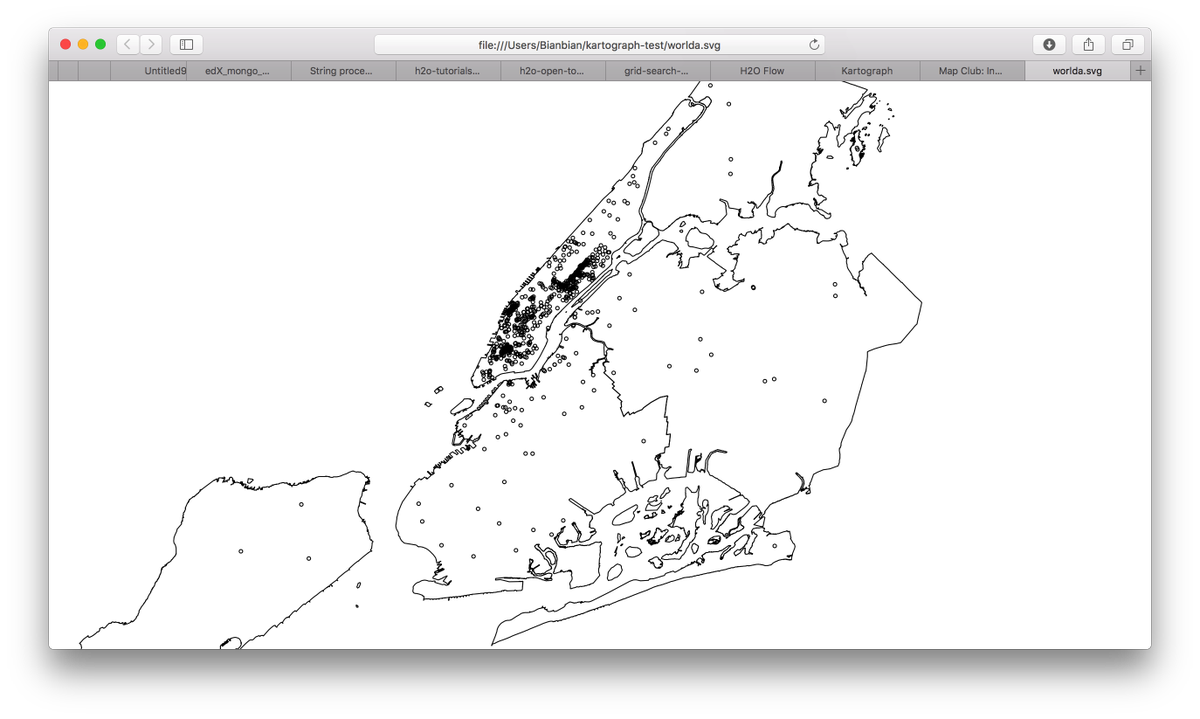
After installing the framework and its dependencies, attendees experimented with Kartograph.py to transform shapefiles into web-ready SVG maps. Jingying accessed NYC OpenData to generate a static map of galleries in New York City:
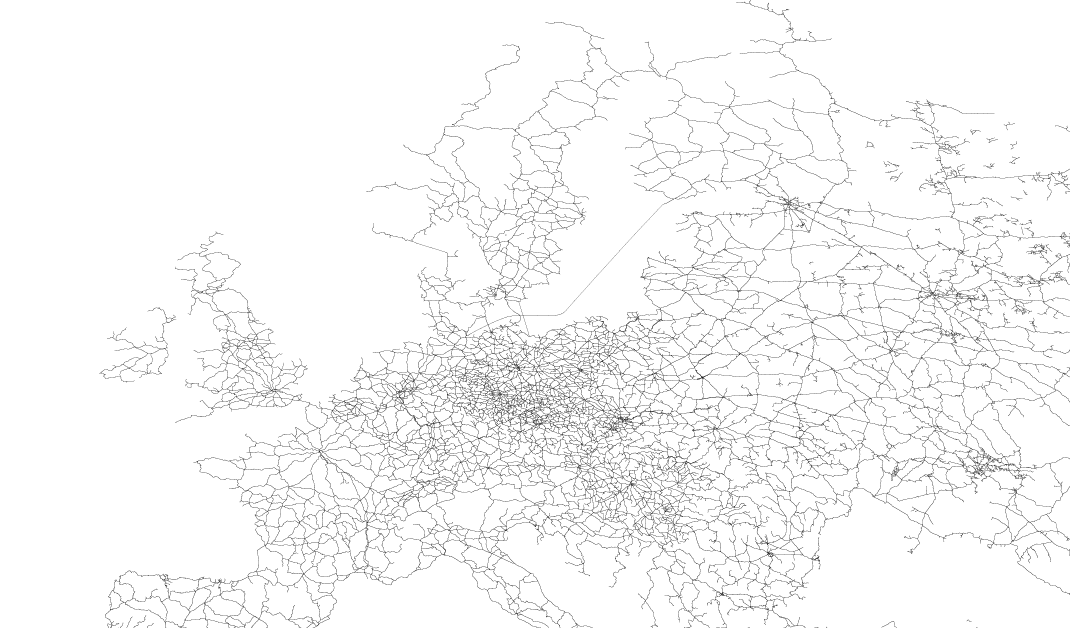
Natural Earth provided a map of the European railway system to refine in Adobe Illustrator:
Next week, we’ll take a more workshop-like approach to learning QGIS, a free and open source geographic information system. See you then!
For this session’s resources and materials, visit the Map Club Github repository.